1 Introduction
Diabetes mellitus is a rapidly escalating global health issue, and India stands at the forefront of this epidemic, often termed the “diabetes capital” of the world. Kerala, a state known for its advanced health indicators compared to other Indian states, paradoxically faces one of the highest rates of diabetes in the country. Despite Kerala's overall improved life expectancy, literacy rates, and healthcare access, it has also witnessed significant lifestyle changes over the past few decades. Urbanization, sedentary lifestyles, altered dietary patterns, and an aging population are driving a surge in non-communicable diseases (NCDs), including diabetes.
The prevalence of diabetes in Kerala is notably higher than the national average, with approximately one in five adults being affected, according to various studies. This sharp rise not only impacts the quality of life of individuals but also imposes a heavy burden on the healthcare system. As diabetes remains a lifelong condition with significant complications such as cardiovascular disease, neuropathy, nephropathy, and retinopathy, the costs associated with its management are substantial.
The Indian Diabetes Risk Score (IDRS) was developed specifically to address the unique characteristics of the Indian population, which may be at risk of diabetes even with lower body mass index (BMI) compared to Western populations. IDRS is a simple, cost-effective tool that can be used for large-scale screening in community settings. It takes into account key risk factors like age, physical inactivity, abdominal obesity, and family history of diabetes, making it a valuable tool for identifying individuals at risk, especially in resource-limited environments.
1.1 The Need for the Study
Despite the alarming rise in diabetes cases in Kerala, there has been a relative lack of large-scale community-based screening studies to assess diabetes risk at the population level. Most existing studies focus on clinically diagnosed diabetes rather than the underlying risk in the general population. Given that a substantial portion of those at risk for diabetes may remain undiagnosed until they develop complications, early identification through risk assessment tools like the IDRS is critical for effective prevention.
This study is therefore crucial for several reasons:
Preventive Action: Early identification of individuals at high risk for diabetes allows for timely interventions. These can include lifestyle modifications such as increased physical activity, dietary changes, and regular monitoring, potentially preventing or delaying the onset of diabetes.
Public Health Strategy: Kerala’s health infrastructure is well-positioned to implement large-scale preventive measures. However, the lack of region-specific data on diabetes risk undermines the development of targeted public health policies. The study will provide empirical evidence that can guide the formulation of effective diabetes prevention strategies at the state level.
Burden on Healthcare: Without proactive screening and intervention, the diabetes epidemic will continue to overwhelm Kerala's healthcare system, leading to increased costs due to diabetes-related complications. This study will help prioritize resources for high-risk groups, ensuring more efficient use of public health funds.
Population-Specific Insights: Kerala has unique socio-demographic characteristics, including a rapidly aging population and high levels of literacy. These factors could influence the prevalence of diabetes and the effectiveness of preventive measures. This study will provide insights specific to Kerala’s population, contributing to a deeper understanding of the drivers behind the state’s high diabetes rates.
By assessing the diabetes risk using the IDRS, this study aims to fill a critical gap in public health research in Kerala. The findings will be invaluable in shaping public health policy, guiding early intervention programs, and potentially curbing the diabetes epidemic in the state before it reaches unmanageable proportions.
2 Methodology
2.1 Study Settings and design
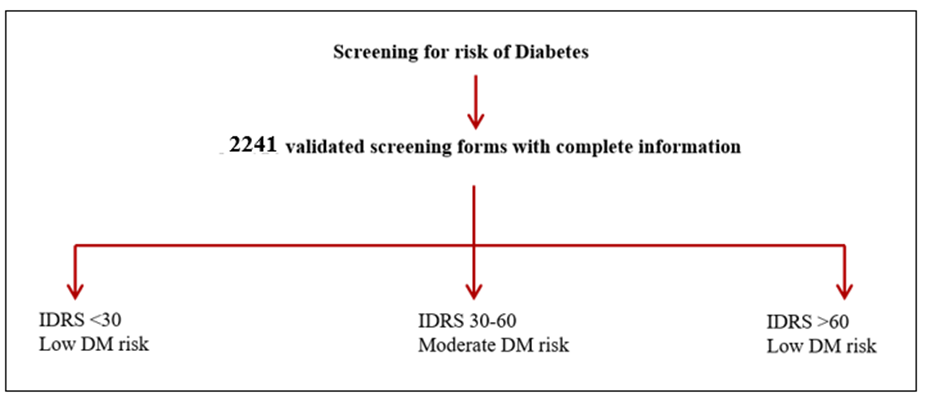
This was a community based cross sectional study conducted from November 1, 2023 until December 31, 2023. The study was done among 2241 individuals in the age group 18 to 90 years in 14 districts of Kerala.
2.2 Risk assessment tool IDRS score
| Sl. No. | Factor | Score |
|---|---|---|
| 1. | Age | |
| <35 years | 0 | |
| 35-49 years | 20 | |
| >50 years | 30 | |
| 2. | Abdominal obesity | |
| <80 cm (F), <90 cm (M) | 0 | |
| 80- 89 cm (F), 90-99 cm (M) | 10 | |
| >90 cm (F), >100 cm (M) | 20 | |
| 3. | Physical activity | |
| Vigorous exercise or Strenuous at work | 0 | |
| Moderate exercise at work / home | 10 | |
| Mild exercise at work / home | 20 | |
| No exercise at work / home | 30 | |
| 4. | Family history of diabetes | |
| No parent diabetic | 0 | |
| Either parent diabetic | 10 | |
| Both parents diabetic | 20 | |
| Maximum score | 100 | |
| Scoring- <30: Low risk, 30-59: Moderate risk, ≥60: High risk | ||
(Reference: Mohan et al, 2005[5])
The study assessed diabetes risk as per the IDRS (Indian Diabetic Risk Score) and analysed the future risk of diabetes in the participants. The IDRS was developed by Mohan et al.[5] as part of the Chennai Urban Rural Epidemiology Study (CURES) to assess the future risk of developing diabetes. It is a simplified risk score for identifying undiagnosed diabetic subjects taking into account two modifiable risk factors (waist circumference and physical inactivity) and two non-modifiable risk factors (age and family history of diabetes), which may be amenable to intervention. The individuals were classified as having high risk (score >60), moderate risk (score 30 - 50) and low risk score[2].
Various studies have validated it, and its cost‑effectiveness in screening prediabetics and diabetics is well documented[13]. The IDRS tool and its scoring is presented in [Table. 1].
2.3 Data collection
Data was collected in a questionnaire-based screening form. Demographic details of the participants such as name, gender, weight, height, educational qualification, area of residence, economical status, comorbidities were collected on a preformed questionnaire along the IDRS parameters- age, waist circumference, physical activity, and family history of diabetes. The economic status was measured using the Kuppusamy scale[6].
2.4 Statistical analysis
Statistical Package for Social Sciences [SPSS] for Windows Version 22.0 Released 2013. Armonk, NY: IBM Corp., will be used to perform statistical analyses.
Descriptive Statistics- Descriptive analysis of all the explanatory and outcome parameters will be done using frequency and proportions for categorical variables, whereas in Mean & SD for continuous variables.
Inferential Statistics- Kruskal Wallis Test followed by Dunn's post hoc test was used to compare the mean age based on the Risk of diabetes among study participants. Chi Square Test was used to compare the Risk of Diabetes as per IDRS based on the gender, education qualification, area of location, BMI status and comorbidity status of the study participants. The level of significance was set at p<0.05.
3 Results
The study included a total of 2,241 participants, with the age distribution showing that 51.3% (n=1,150) were younger than 35 years, 31.9% (n=714) were between 35 and 49 years, and 16.8% (n=377) were 50 years or older. The mean age of the participants was 36.52 ± 12.19 years, with ages ranging from 16 to 89 years. In terms of gender distribution, the majority of the participants were female, accounting for 74.4% (n=1,667) of the study population, while males made up the remaining 25.6% (n=574). These findings provided a comprehensive overview of the age and gender distribution among the study participants.
| Variable | Category | n | % |
|---|---|---|---|
| Age | < 35 yrs. | 1150 | 51.3% |
| 35 - 49 yrs. | 714 | 31.9% | |
| ≥ 50 yrs. | 377 | 16.8% | |
| Gender | Males | 574 | 25.6% |
| Females | 1667 | 74.4% |
The distribution of educational qualifications among the study participants revealed that a majority, 56.0% (n=1,255), had an intermediate or diploma level of education. Graduates accounted for 9.0% (n=201) of the study population, while those with a high school certificate represented a very small proportion, at 0.1% (n=2). Additionally, a significant portion of the participants, 34.9% (n=783), were illiterate. These findings highlighted a varied range of educational backgrounds among the study participants, with the largest group having attained an intermediate or diploma level of education and a notable percentage being illiterate.
Variable | Category | n | % |
|---|---|---|---|
| Educational qualification | Graduate | 201 | 9.0% |
Intermediate or diploma | 1255 | 56.0% | |
High School Certificate | 2 | 0.1% | |
Illiterate | 783 | 34.9% |
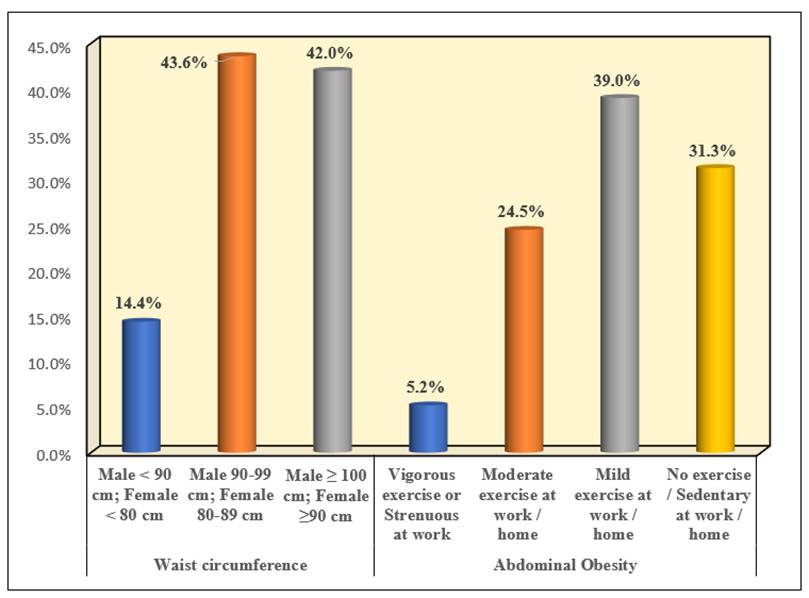
The distribution of anthropometric parameters among the study participants revealed several key patterns. In terms of waist circumference, 14.4% (n=322) of the participants had measurements less than 90 cm for males and less than 80 cm for females. The largest group, representing 43.6% (n=977) of the participants, had waist circumferences ranging from 90-99 cm for males and 80-89 cm for females. Additionally, 42.0% (n=942) of the participants had waist circumferences of 100 cm or more for males and 90 cm or more for females. Regarding abdominal obesity, the study found that only a small portion of the participants, 5.2% (n=117), engaged in vigorous exercise or had strenuous work activities. A larger group, accounting for 24.5% (n=549) of the participants, performed moderate exercise either at work or at home. The majority of the participants, 39.0% (n=873), engaged in mild exercise at work or home. Finally, 31.3% (n=702) of the participants reported no exercise or led a sedentary lifestyle at work or home. These findings highlighted the varying levels of waist circumference and physical activity among the study participants, with a significant portion exhibiting higher abdominal obesity and lower levels of physical activity.
| Variable | Category | n | % |
|---|---|---|---|
| Waist circumference | Male < 90 cm; Female < 80 cm | 322 | 14.4% |
| Male 90-99 cm; Female 80-89 cm | 977 | 43.6% | |
| Male ≥ 100 cm; Female ≥90 cm | 942 | 42.0% | |
| Abdominal Obesity | Vigorous exercise or Strenuous at work | 117 | 5.2% |
| Moderate exercise at work / home | 549 | 24.5% | |
| Mild exercise at work / home | 873 | 39.0% | |
| No exercise / Sedentary at work / home | 702 | 31.3% |
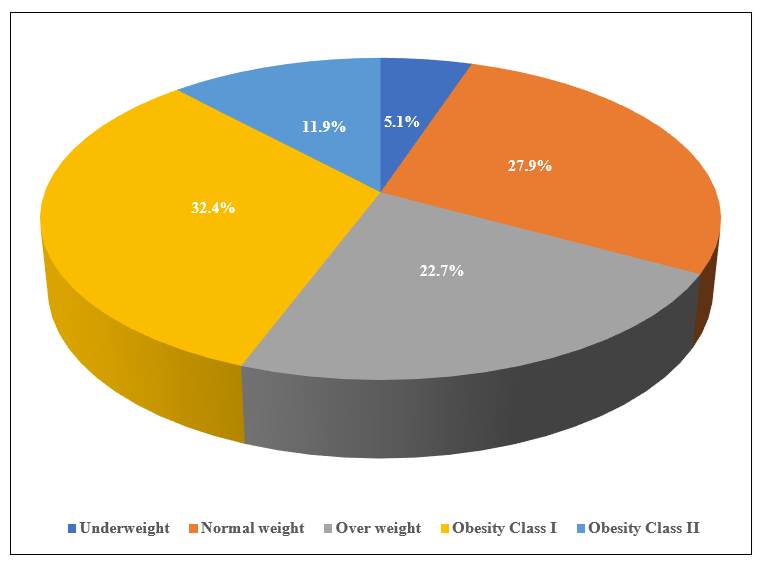
The distribution of BMI status among the study participants showed that a minority of the participants, 5.1% (n=114), were underweight. A larger group, representing 27.9% (n=626) of the participants, fell into the normal weight category. Additionally, 22.7% (n=508) of the participants were classified as overweight. A substantial proportion of the study population was categorized as Obesity Class I, accounting for 32.4% (n=726) of the participants. Furthermore, 11.9% (n=267) of the participants were classified as Obesity Class II. These findings indicated a diverse range of BMI statuses among the study participants, with a notable percentage falling into the obesity categories.
| Variable | Category | n | % |
|---|---|---|---|
| BMI Status | Underweight | 114 | 5.1% |
| Normal weight | 626 | 27.9% | |
| Over weight | 508 | 22.7% | |
| Obesity Class I | 726 | 32.4% | |
| Obesity Class II | 267 | 11.9% |
Note: The BMI Status have been classified based on Asian Pacific classification of BMI (Asia Pacific report WHO, IASO, IOTF 2000)[15]
| Variable | Category | n | % |
|---|---|---|---|
| Family history of diabetes | Two non-diabetic parents | 1001 | 44.7% |
| Either parent diabetic | 965 | 43.1% | |
| Both parents diabetic | 275 | 12.3% | |
| Comorbidities | Present | 745 | 33.2% |
| Absent | 1496 | 66.8% |
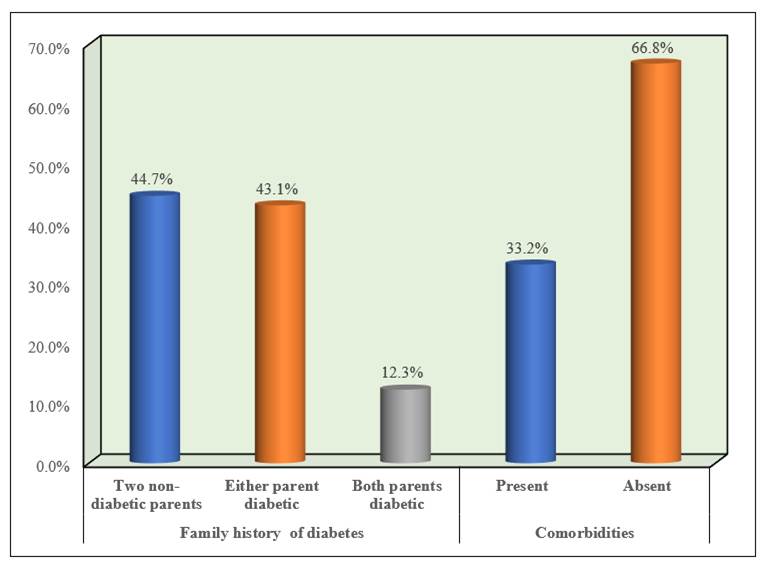
The distribution of family history of diabetes among the study participants showed that 44.7% (n=1,001) had two non-diabetic parents. A slightly lower percentage, 43.1% (n=965), had either parent diabetic, while 12.3% (n=275) had both parents diabetes.
In terms of comorbidities, 33.2% (n=745) of the participants had comorbid conditions, whereas 66.8% (n=1,496) did not have any comorbidities. These findings highlighted that a significant portion of the study participants had a family history of diabetes and that a notable percentage also had comorbid conditions.
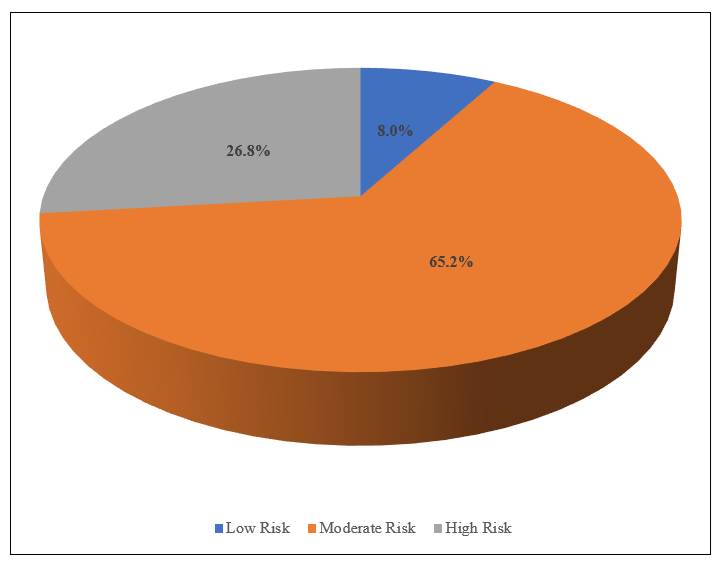
The distribution of diabetes risk among the study participants, as assessed by the Indian Diabetes Risk Score (IDRS), indicated that a small portion, 8.0% (n=180), were classified as having a low risk of developing diabetes. The majority of the participants, 65.2% (n=1,461), were categorized as having a moderate risk. Additionally, 26.8% (n=600) of the participants were found to be at high risk of developing diabetes. These findings highlighted that a significant proportion of the study population fell into the moderate and high-risk categories, suggesting a substantial potential burden of diabetes among the participants.
| Variable | Category | n | % |
|---|---|---|---|
| Risk | Low Risk | 180 | 8.0% |
| Moderate Risk | 1461 | 65.2% | |
| High Risk | 600 | 26.8% |
| IDRS score | N | Mean | SD | Min | Max | p-value a | Sig. Diff | p-value b |
|---|---|---|---|---|---|---|---|---|
| Low Risk | 180 | 28.47 | 7.81 | 16 | 54 | <0.001* | L vs M | <0.001* |
| Moderate Risk | 1461 | 34.90 | 11.55 | 17 | 89 | L vs H | <0.001* | |
| High Risk | 600 | 42.88 | 12.06 | 18 | 84 | M vs H | <0.001* |
Note: a. Kruskal Wallis Test & b. Dunn’s post hoc Test.
* - Statistically Significant
For the Low Risk group, the mean age was 28.47 ± 7.81 years, with a minimum age of 16 and a maximum age of 54. For the Moderate Risk group, the mean age was 34.90 ± 11.55 years, with ages ranging from 17 to 89. The High Risk group had a mean age of 42.88 ± 12.06 years, with a minimum age of 18 and a maximum age of 84. The Test indicated a statistically significant difference in mean ages among the different risk groups (p < 0.001). Multiple comparison Test further revealed significant differences in mean ages between all pairs of risk groups (Low vs Moderate: p < 0.001; Low vs High: p < 0.001; Moderate vs High: p < 0.001). These results indicated that the mean age of participants increased with the risk of diabetes, with older ages associated with higher risk categories.
| Variable | Category | Low Risk | Moderate Risk | High Risk | p-value | |||
|---|---|---|---|---|---|---|---|---|
| n | % | n | % | n | % | |||
| Gender | Males | 83 | 14.5% | 368 | 64.1% | 123 | 21.4% | <0.001* |
| Females | 97 | 5.8% | 1093 | 65.6% | 477 | 28.6% | ||
* - Statistically Significant
The study compared the risk of diabetes based on the Indian Diabetes Risk Score (IDRS) across genders using the Chi-Square Test. Among male participants, 14.5% were classified as Low Risk, 64.1% as Moderate Risk, and 21.4% as High Risk. In contrast, among female participants, 5.8% were classified as Low Risk, 65.6% as Moderate Risk, and 28.6% as High Risk. The test revealed a statistically significant difference in the distribution of diabetes risk between males and females (p < 0.001). These findings highlighted that a higher proportion of females were at high risk of developing diabetes compared to males, despite both genders having a similar proportion in the moderate-risk category. This indicated a notable gender difference in diabetes risk, with females being more susceptible to higher risk levels.
| Variable | Category | Low Risk | Moderate Risk | High Risk | p-value | |||
|---|---|---|---|---|---|---|---|---|
| n | % | n | % | n | % | |||
| BMI Status | Underweight | 13 | 11.4% | 89 | 78.1% | 12 | 10.5% | <0.001* |
| Normal weight | 83 | 13.3% | 413 | 66.0% | 130 | 20.8% | ||
| Over weight | 29 | 5.7% | 332 | 65.4% | 147 | 28.9% | ||
| Obesity Class I | 46 | 6.3% | 474 | 65.3% | 206 | 28.4% | ||
| Obesity Class II | 9 | 3.4% | 153 | 57.3% | 105 | 39.3% | ||
* - Statistically Significant
The study highlighted significant variations in the risk of diabetes among participants based on their BMI status. Underweight participants had 11.4% at low risk, 78.1% at moderate risk, and 10.5% at high risk of diabetes, indicating a relatively lower presence of high-risk cases. Participants with normal weight had slightly higher proportions, with 13.3% at low risk, 66.0% at moderate risk, and 20.8% at high risk. Overweight individuals showed a notable shift towards higher diabetes risk, with 5.7% at low risk, 65.4% at moderate risk, and 28.9% at high risk. This trend continued with participants in Obesity Class I, where 6.3% were at low risk, 65.3% at moderate risk, and 28.4% at high risk, reflecting a strong association between increasing BMI and elevated diabetes risk.
Notably, participants in Obesity Class II exhibited the most concerning figures, with only 3.4% at low risk, 57.3% at moderate risk, and a significant 39.3% at high risk, underscoring the critical impact of severe obesity on diabetes prevalence. Overall, the findings demonstrated a clear trend: as BMI increased, so did the proportion of participants at high risk of diabetes. These differences in diabetes risk across BMI categories were statistically significant, with a p-value < 0.001.
| Variable | Category | Low Risk | Moderate Risk | High Risk | p-value | |||
|---|---|---|---|---|---|---|---|---|
| n | % | n | % | n | % | |||
| Comorbidities | Present | 35 | 4.7% | 447 | 60.0% | 263 | 35.3% | <0.001* |
| Absent | 145 | 9.7% | 1014 | 67.8% | 337 | 22.5% | ||
* - Statistically Significant
Among participants with comorbidities, 4.7% were at low risk, 60.0% were at moderate risk, and 35.3% were at high risk of diabetes. This distribution showed a substantial presence of high-risk cases, emphasizing the increased diabetes risk associated with existing comorbidities. In contrast, participants without comorbidities had a higher percentage at low risk (9.7%), with 67.8% at moderate risk and 22.5% at high risk. Although the majority were still at moderate risk, the high-risk category was considerably lower compared to participants with comorbidities. Overall, these findings indicated that the presence of comorbidities significantly heightened the risk of diabetes, with those having comorbidities facing a higher proportion of high-risk for developing diabetes. This difference was statistically significant, with a p-value < 0.001, highlighting the critical impact of comorbidities on diabetes risk.
| Variable | Category | Low Risk | Moderate Risk | High Risk | p-value | |||
|---|---|---|---|---|---|---|---|---|
| n | % | n | % | n | % | |||
| Waist circumference | Male < 90 cm; Female < 80 cm | 78 | 24.2% | 220 | 68.3% | 24 | 7.5% | <0.001* |
| Male 90-99 cm; Female 80-89 cm | 85 | 8.7% | 709 | 72.6% | 183 | 18.7% | ||
| Male ≥ 100 cm; Female ≥90 cm | 17 | 1.8% | 532 | 56.5% | 393 | 41.7% | ||
* - Statistically Significant
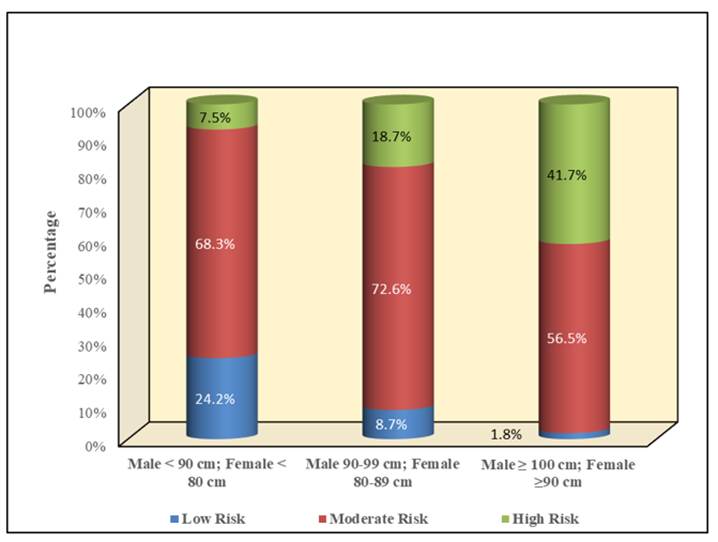
The comparison of the risk of diabetes based on waist circumference reveals significant differences across the different risk groups. Among individuals with a waist circumference less than 90 cm for males and less than 80 cm for females, the majority, 68.3% (n=220), fall into the moderate risk category, with 24.2% (n=78) in the low risk category and 7.5% (n=24) in the high risk category. For those with a waist circumference between 90-99 cm for males and 80-89 cm for females, a smaller percentage, 8.7% (n=85), are in the low risk category, while 72.6% (n=709) are at moderate risk and 18.7% (n=183) at high risk. In contrast, individuals with a waist circumference of 100 cm or more for males and 90 cm or more for females have the highest proportion in the high risk category, with 41.7% (n=393) in high risk, only 1.8% (n=17) in low risk, and 56.5% (n=532) in moderate risk. These findings highlight that as waist circumference increases, the proportion of individuals at high risk of diabetes also increases significantly. The differences observed between the risk groups based on waist circumference were statistically significant (p < 0.001).
| Variable | Category | Low Risk | Moderate Risk | High Risk | p-value | |||
|---|---|---|---|---|---|---|---|---|
| n | % | n | % | n | % | |||
| Physical activity | Vigorous exercise or Strenuous at work | 60 | 51.3% | 57 | 48.7% | 0 | 0.0% | <0.001* |
| Moderate exercise at work / home | 104 | 18.9% | 410 | 74.7% | 35 | 6.4% | ||
| Mild exercise at work / home | 16 | 1.8% | 639 | 73.2% | 218 | 25.0% | ||
| No exercise / Sedentary at work/home | 0 | 0.0% | 355 | 50.6% | 347 | 49.4% | ||
* - Statistically Significant
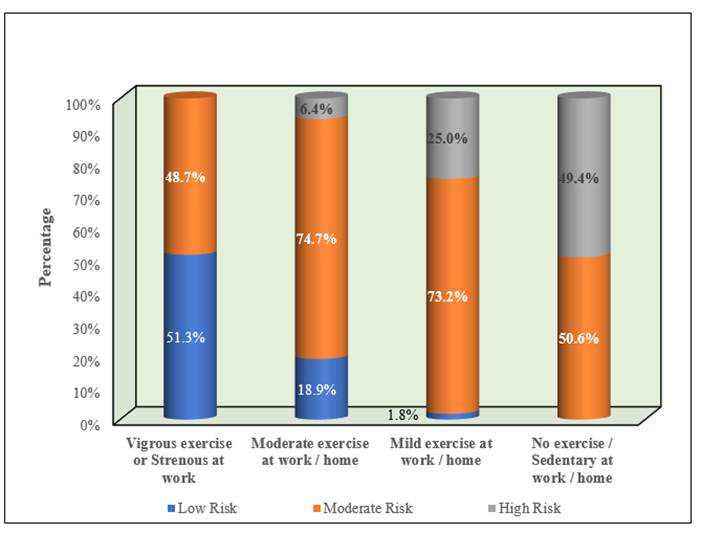
The comparison of the risk of diabetes based on physical activity reveals significant differences across different risk groups. Individuals who engage in vigorous exercise or have strenuous work show that 51.3% (n=60) are at low risk, 48.7% (n=57) are at moderate risk, and none are at high risk. Those who do moderate exercise at work or home have 18.9% (n=104) at low risk, 74.7% (n=410) at moderate risk, and 6.4% (n=35) at high risk. For individuals doing mild exercise at work or home, only 1.8% (n=16) are at low risk, 73.2% (n=639) are at moderate risk, and 25.0% (n=218) are at high risk. In contrast, individuals with no exercise or sedentary work or home lifestyle show that none are at low risk, 50.6% (n=355) are at moderate risk, and 49.4% (n=347) are at high risk. These findings highlight that higher physical activity levels are associated with lower diabetes risk, while low or no physical activity significantly increases the risk of diabetes. The differences observed between the risk groups based on physical activity were statistically significant (p < 0.001).
| Variable | Category | Low Risk | Moderate Risk | High Risk | p-value | |||
|---|---|---|---|---|---|---|---|---|
| n | % | n | % | n | % | |||
| Family history of diabetes | Two non-diabetic parents | 145 | 14.5% | 767 | 76.6% | 89 | 8.9% | <0.001* |
| Either parent diabetic | 35 | 3.6% | 597 | 61.9% | 333 | 34.5% | ||
| Both parents diabetic | 0 | 0.0% | 97 | 35.3% | 178 | 64.7% | ||
* - Statistically Significant
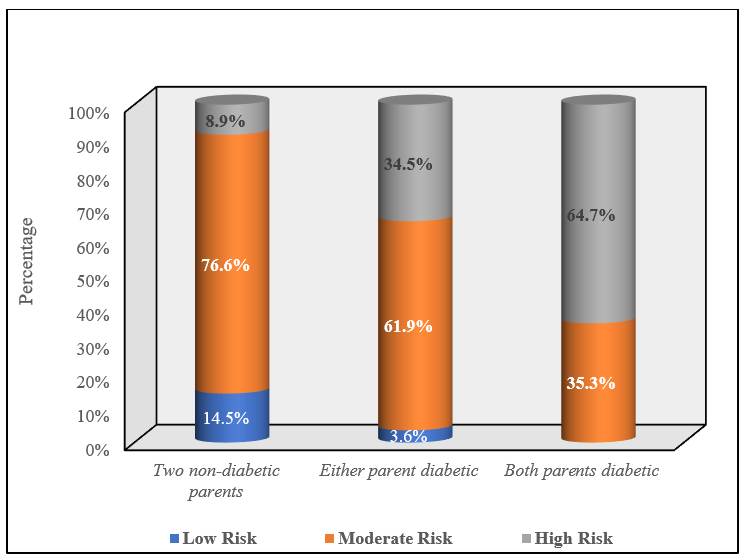
The comparison of the risk of diabetes based on family history reveals significant differences across different risk groups. Among individuals with two non-diabetic parents, 14.5% (n=145) are at low risk, 76.6% (n=767) are at moderate risk, and 8.9% (n=89) are at high risk. For those with either parent diabetic, a smaller percentage, 3.6% (n=35), are at low risk, 61.9% (n=597) are at moderate risk, and a much higher percentage, 34.5% (n=333), are at high risk. In contrast, individuals with both parent diabetic show that none are at low risk, 35.3% (n=97) are at moderate risk, and a significantly higher percentage, 64.7% (n=178), are at high risk. These findings indicate that a family history of diabetes significantly increases the risk of diabetes, with the highest risk observed in individuals with both parents’ diabetic. The differences observed between the risk groups based on family history were statistically significant (p < 0.001).
4 Discussion
Non-Communicable Diseases (NCDs) contribute to 74% of global deaths, with a significant burden in low- and middle-income countries (77%) (World Health Organization). Diabetes, a major NCD, is of increasing concern in India. Our study in Kerala, with 2241 participants aged 16 to 89 years, assessed diabetes risk using the Indian Diabetic Risk Score (IDRS). Results showed 26.8% of participants at high risk of diabetes. Comparatively, studies from other Indian cities reported higher high-risk proportions: Meerut (33.4%), Delhi (39.6%), Pune (36.5%), Urban Chennai (43%), Hyderabad (38%), and Tripura (34.2%). A multidomain study across India reported a high-risk prevalence of 40.9%.
The study found diabetes risk increases with age. Participants aged 18–84 (mean age 42.88 ± 12.06 years) were at high risk, while those aged 17–89 (mean age 34.90 ± 11.55 years) were at moderate risk (p = 0.001). Supporting studies, such as one from Andhra Pradesh, showed similar trends with 37% of high-risk individuals aged 36–50 years and 21% above 50 years. Acharya et al. (2017)[1] reported 75% of participants aged 30–49 years, with an overall mean age of 43.38 ± 11.26 years.
Educational qualifications were not statistically significant in determining diabetes risk (p = 0.63). However, 34.9% of participants were illiterate, underscoring the need for targeted awareness interventions. Namdev et al.[8] reported literacy rates of 58.1% and 67.8%, and Halder et al. found one-third of participants illiterate (29.5%).
Waist circumference (WC), an indicator of abdominal obesity, was significantly associated with diabetes risk (p < 0.001). Anand et al.[2] observed gender differences: 42.1% of males and 51.4% of females had WC above the threshold for central obesity. Acharya et al.[1] reported similar patterns, with 42% of participants showing central obesity. This highlights the need for interventions addressing obesity and related health risks.
Physical activity showed a significant impact on diabetes risk. Only 5.2% of participants engaged in vigorous activity, while 68.5% performed mild to moderate activity, and 31.3% led sedentary lifestyles. Vigorous activity participants had no high-risk cases, while sedentary participants showed 49.4% at high risk (p < 0.05). Similar patterns were noted in studies by Singh et al. and Anand et al.[2, 7].
Participants were categorized by BMI: 5.1% underweight, 27.9% normal, 22.7% overweight, 32.4% Obesity Class I, and 11.9% Obesity Class II. Obesity significantly increased diabetes risk, consistent with studies by Sri PKSSU et al., Dugg et al., and Gupta et al. Associations were observed between diabetes risk and factors such as BMI, gender, and diet (p < 0.05)[12, 14].
A family history of diabetes significantly influenced risk. Participants with no family history had 8.9% high risk, compared to 34.5% with one diabetic parent and 64.7% with both diabetic parents (p < 0.001). Comorbidities also increased high-risk proportions to 35.3%, compared to 22.5% without comorbidities.
Using IDRS, 34% of participants were at high risk, consistent with Sri PKSSU et al. and Brahmbhatt (34%)[14]. This was higher than Arun et al. (14.9%) and Panda et al. (17.9%) but lower than Mani et al. (59%). Moderate-risk participants (45.4%) were comparable to Gupta et al. but lower than Sowmiya et al. (50.9%)[12].
Indian dietary pattern is highly variant and region-specific ranging from strict vegetarian or vegan diet to addition of sweets, savoury snacks, meats and other high fat, sugar salt containing foods. Individuals who have large portion meals, generally exceeding 30% of the requirement are more at risk of obesity. Asian Indians being at increased risk of developing diabetes and CVDs at lower BMIs should have a self-regulated intake pattern to regulate the portion size[3, 4, 9-11].
4.1 Implications for Public Health
This study highlights the urgent need for large-scale diabetes prevention strategies in Kerala. Key recommendations include:
Community-Based Screening: Implementing IDRS as a routine screening tool in community health programs to identify at-risk individuals early.
Lifestyle Interventions: Promoting physical activity, balanced diets, and weight management through awareness campaigns and community initiatives.
Targeted Educational Programs: Developing tailored educational interventions for illiterate and less-educated populations to improve diabetes literacy.
Policy Advocacy: Leveraging the findings to advocate for diabetes prevention policies that address region-specific risk factors, including dietary habits and urbanization.
Integrated Care Models: Addressing comorbidities and providing comprehensive care to at-risk individuals to mitigate long-term complications.
In conclusion, the use of IDRS provides valuable insights into diabetes risk in Kerala, highlighting key areas for intervention. By addressing the identified risk factors through targeted public health actions, Kerala can significantly reduce its diabetes burden and improve population health outcomes.
5 Acknowledgement
This study was conducted by the members of Community Nutrition Forum, Kerala. We sincerely thank the entire respondents for their time and support.