1 Introduction
Diabetes mellitus (DM) is a group of metabolic diseases characterized by high levels of blood glucose. DM can cause many acute and chronic complications if left untreated. Diabetes mellitus occurs throughout the world but is more common (especially type 2) in the more developed countries. The greatest increase in prevalence is, however, occurring in low- and middle-income countries including in Asia and Africa.
The prevalence of diabetes for all age-groups worldwide was estimated to be 2.8% in 2000 and 4.4% in 2030[1]. Type 2 diabetes makes up about 85-90% of all cases. As of 2016, an estimated 422 million adults are living with diabetes mellitus, according to the data from the World Health Organization (WHO)[2]. Diabetes prevalence is increasing rapidly, and the total number of people with diabetes is projected to rise from 171 million in 2000 to 366 million in 2030.
Until recently, India had more diabetics than any other country in the world, according to the International Diabetes Foundation,[3] although the country has now been surpassed in the top spot by China[4]. Diabetes currently affects more than 62 million Indians, which is more than 7.1% of the adult population[5]. According to the Indian Heart Association, India is projected to be home to 109 million individuals with diabetes by 2035[6]. The average age of onset is 42.5 years[3].
The WHO estimates that diabetes resulted in 1.5 million deaths in 2012, making it the 8th leading cause of death[2]. However, another 2.2 million deaths worldwide were attributable to high blood glucose and the increased risks of associated complications (e.g. heart disease, stroke, kidney failure).
The prevalence of diabetes is higher in men than women, but there are more women with diabetes than men. The urban population in developing countries is projected to double between 2000 and 2030. The most important demographic change to diabetes prevalence across the world appears to be the increase in the proportion of people >65 years of age.
In developing countries, the majority of people with diabetes are in the 45- to 64-year age range, similar to the finding reported previously[7]. In contrast, the majority of people with diabetes in developed countries are >64 years of age. By 2030, it is estimated that the number of people with diabetes >64 years of age will be >82 million in developing countries and >48 million in developed countries.
The increase in incidence in developing countries follows the trend of urbanization and lifestyle changes, including increasingly sedentary lifestyles, less physically demanding work and the global nutrition transition, marked by increased intake of foods that are high energy-dense but nutrient-poor (often high in sugar and saturated fats, referred to as the Western pattern diet)[1, 2].
1.1 Dietary Management in DM
There are many dietary advice and options readily available for diabetics. Diet is considered to be one of the cornerstones in the management of diabetes mellitus and more so in the case of noninsulin-dependent diabetes mellitus (NIDDM), in which the primary derangement is of Carbohydrate metabolism, with secondary abnormalities of lipid and protein metabolism. Dietary management of diabetes involves the reduction of postprandial hyperglycemia and good glycemic control.
Foods with a low glycemic index have lower blood glucose response and are useful to manage Type 2 diabetes and also tend to improve control of blood pressure and plasma low density lipoprotein cholesterol levels due to less pronounced insulin response.
It is well documented that consumption of whole grains, even without reduction in overall carbohydrate intake, reduces risk factors for CVD, including BMI, insulin sensitivity, and type 2 diabetes. Various epidemiologic cohort studies have demonstrated that a 2- or 3-serving-per-day increase in whole grain consumption is associated with a 20–30% decrease in type 2 diabetes, even after adjustment for confounders such as age, gender, and BMI[11-13].
1.2 Review of Literature
Currently, there is no known cure for DM[8]. The management primarily concentrates on keeping the blood sugar levels under good control, while at the same time also avoiding hypoglycemia. Patients with a good control of blood sugars have been shown to have less risk of complications as compared with patients with poor glycemic control[9, 10].
Some have even provided advice on food groups down to grain type[14]. Recently, millets are receiving increasing spotlight in combating diabetes as a dietary option. Indeed, there are evidences to support that millets have many properties making it a good dietary option for diabetics. The ability of certain millets and pseudocereals to lower postprandial glycemia has been extensively studied[3].
Amongst millets antidiabetic properties, a study in India reported that patients with T2D fed with foxtail millet for 90 days showed improved glycaemic control as well as other improvements[15]. The patients were given the diet of a combination of foxtail millet, split black gram and spice mix with a high degree of compliance. The result showed a reduced HbA1c, fasting glucose, insulin, and total cholesterol, triglyceride, and LDL concentrations. These were all indications that this diet had a positive impact on DM patients.
The ability of certain pseudo-cereals to lower postprandial glycemia has also been previously reported, including the second meal effect. The second meal effect is the ability of grains to reduce postprandial glycemia not only after a meal at which they were taken but also at a subsequent meal in the day. This effect is beneficial for blood glucose control in diabetic patients and also causes an unanticipated decrease in insulin demands at the subsequent meal.
Jenkins et al.[16] determined that the Staub-Traugott effect (the second meal effect), lasted from breakfast to lunch (a 4 hour period) by showing that slow digesting carbohydrate breakfast meals improved glucose tolerance during a subsequent lunch.
Other studies made in individuals with celiac disease showed that quinoa has a glycemic index slightly lower than that of gluten free bread and pasta[17].
Despite the high GI of quinoa and early high blood glucose peak (peak at 30 min in healthy and at 60 min in diabetic subjects)[18], concentrations of blood glucose after consuming quinoa meal breakfasts steadily began to decline and returned to below baseline levels. This could be explained by the fact that quinoa contains considerably a high content of health-beneficial phytochemicals including vitamin E, iron, zinc and magnesium contents, as well as saponins, phenolics and phytosterols[19]. These bioactive compounds may attenuate carbohydrate metabolism and hyperglycemia; improve pancreatic β- cell function and insulin release[20].
Abugoch et al. found antioxidants capacity compounds such as polyphenols, phytosterols, and flavonoids in grains of quinoa[21]. These compounds may be related to the effects of the reduction in postprandial glucose levels in the individuals tested, suggesting an improvement in insulin action and pancreatic function.
Gabrial et al.[22] found that a second-meal effect in the form of a reduced glucose response to a high GI lunch was also shown after quinoa breakfast meal. The results add to evidence that quinoa improves glucose tolerance at a subsequent high glycemic second meal. Furthermore, in diabetic subjects they found that that quinoa breakfast meal improved postprandial glycemia, resulting in a flattened postprandial curve, indicating modulation in insulin response to the glucose released into blood, and prevention of rebound hypoglycemia.
The second meal effect of quinoa may be attributed to the fact that quinoa contains Alpha-glucosidase inhibitors which act at the small intestine's brush border, inactivating the enzyme responsible for breaking down complex carbohydrates (slowing digestion and absorption of high GI meal lunch), prolonging glucose absorption, and flattening the postprandial glycemic curve.
Plasma cholesterol concentration has also been found to decrease by consumption of quinoa seeds. Some proteins from quinoa can influence the total serum cholesterol level. It is suggested that the hypocholesterolemic effect of quinoa could be produced by the fiber, saponins or squalene, which are also present in these seeds.
2 Materials and Methods
2.1 Objectives
1. To assess the glycemic state of diabetic subjects using fasting and post-prandial blood sugars.
2. To analyze their nutrient intake using 24 hour dietary record.
3. To formulate and supplement quinoa based meal to the experimental group subjects for a period of 4 weeks.
4. To determine the post-prandial blood sugars at baseline, during and after supplementation.
5. To correlate the biochemical and dietary intake of experimental and control group subjects.
2.2 Sampling Technique
The sampling technique used in this study was convenience sampling. All the subjects who were diagnosed to have diabetes mellitus and also who fulfilled the inclusion criteria were selected randomly for initial assessment.
2.3 Sample Size
In the present study the subjects were split into experimental and control groups, out of which equal number of equal number of samples (10) were taken into supplemental group and control group as well out of 30 samples.
2.4 Criteria for Selection of Samples
Inclusion Criteria
Subjects who are >18 years of age
Subjects who are diagnosed to have diabetes mellitus, and
Subjects who are on stable treatment for >1 month.
Exclusion Criteria
Those who are not willing to participate.
Subjects who are < 18 years of age and
Subjects who are not on stable treatment for >1 month.
2.5 Duration of Study
4 weeks.
2.6 Supplementation Period
Once a day at lunch time for 4 weeks.
2.7 Tools Used For Data Collection
The tool used in data collection was Anthropometric assessment. An interview schedule is used in the present study to collect the information about the subjects.
2.8 Anthropometric Assessment
Anthropometric measurements like Height, Weight, and BMI were taken for the subjects both before and after supplementation to compare their initial and final nutritional status.
2.9 Interview Schedule
An interview schedule is used in the present study to collect the information about the subjects. They include demographic data to know the personal details and past medical history to collect the co morbid condition.
Each individual was interviewed with an interview schedule which consists of-
Name
Age
Sex
Past medical history
Diet history
2.10 Biochemical Assessment
Fasting and post-prandial blood sugars were performed in all the subjects before supplementation, to have a view of their baseline glycemic status. Post-prandial sugars were checked during the period of supplementation on every alternate day for the experimental group subjects and control group subjects. The blood sugar assessments of all the subjects were done using a point of care standardized glucometer.
2.11 24 Hour Dietary Record
A menu recording the list of foods consumed over the preceding 24 hours. This helps in recording their calorie, protein, fat, and carbohydrate intake. Thus, in the present study, the calorie and carbohydrate count was calculated using the dietary record which has been collected at baseline, every 10 days during supplementation, and at end of study in the experimental group and in the control group.
2.12 Phase I – Initial Assessment
The initial assessment of each subject participating in the study was assessed using anthropometric data, history of past and present illness and assessing the dietary intake using 24 hour dietary recall method, and fasting, post-prandial sugar assessment. The informed consent form was explained in detail to the selected subjects.
2.13 Phase II – Supplementation and Counselling
Those subjects in the experiment group were supplemented with quinoa based meals at lunch daily. Informed consent was obtained from all the participants before supplementation. Those subjects in the control group were given proper nutritional counseling about the importance of carbohydrate counting and glycemic control. The post-prandial sugar assessment was done every alternate day during the 4 weeks of supplementation in experimental and in control group to check the glycemic status.
2.14 Phase III Reassessment
Reassessment of all the subjects belonging to both study and control group was done. After the supplementation post-prandial blood sugars were collected for analysis. Nutritional intake was also analyzed again at the end of the supplementation with 24 hour dietary recall for both experimental and control for improvement in their food intake.
2.15 Statistical Analysis
The results were tabulated and interpreted using appropriate statistical analysis. Mean, standard Deviation and Mann Whitney test and Wilcoxon signed rank test was done to assess the significance.
3 Observations and Discussion
3.1 Descriptive Statistics
Demographic Data: The demographic data is a collection of information about the characteristics of a study population, such as the age, gender, history of the participants. The demographic data of the current study is presented below:
| Age | Experimental group | Control group | ||
|---|---|---|---|---|
| No. | % | No. | % | |
| 20- 30 | 1 | 10.0 | 1 | 10.0 |
| 30-39 | 3 | 30.0 | 4 | 40.0 |
| 40-49 | 3 | 30.0 | 3 | 30.0 |
| 50-59 | 3 | 30.0 | 2 | 20.0 |
| Total | 10 | 100.0 | 10 | 100.0 |
[Table. 1] shows that, subjects in the age group between 20 to 60 years have participated in the study. The majority of the subjects fall in the 30-39 years age group, with 40% in the control group and 30% in the experimental group.
3.2 Gender profile
All subjects are male in the control group (n=10), while in the experimental group 90% (n=9) are males and 10 % (n=1) are females. There is increasing evidence that sex and gender differences are important in epidemiology, path physiology, treatment, and outcomes in many diseases, but they appear to be particularly relevant for non-communicable diseases. In the domain of endocrinology and metabolism, the greatest body of evidence for important clinical implications of sexual dimorphisms comes from studies in the field of type 2 diabetes mellitus (T2DM). Diabetes is more prevalent in males (2.3 %), than in females (1.4 %). In men, poor glycemic control was found in 37% of the participants reporting non-adherence and in 19% reporting adherence. On the other hand, in women, poor glycemic control was found in 19% of the participants reporting non-adherence and in 18% reporting adherence.
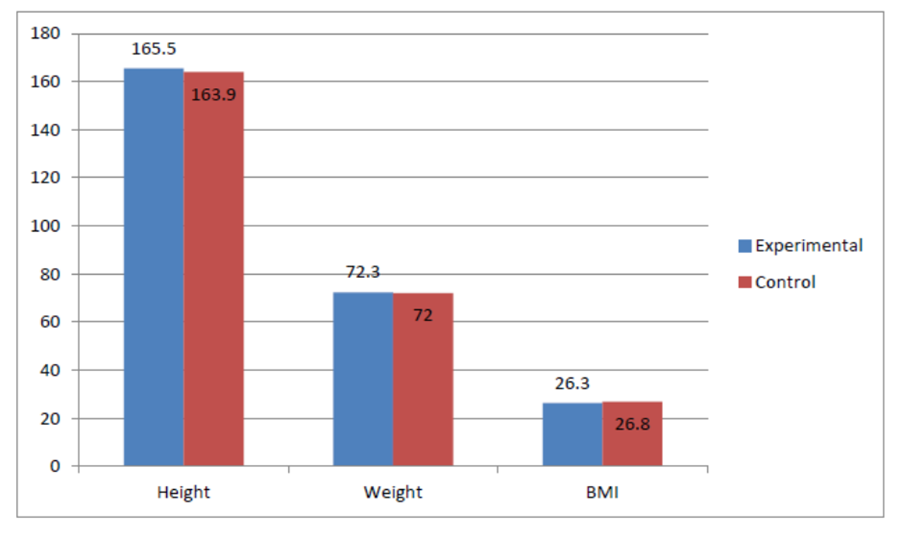
The mean height in the experimental group was 165.5 ± 3.3 cm. The mean weight and BMI in the experimental group were 72.3 ± 9.6 kg, and 26.3 ± 2.9 kg/m2 respectively. The mean height in the control group was 163.9 ± 7.5 cm. The mean weight and BMI in the experimental group were 72 ± 12.7 kg, and 26.8 ± 4.6 kg/m2 respectively.
The subjects in the experimental group had a mild, non-significant greater height and weight, and a lower BMI as compared to control subjects [Fig. 1].
3.3 Blood Sugars of the Experimental Group Subjects
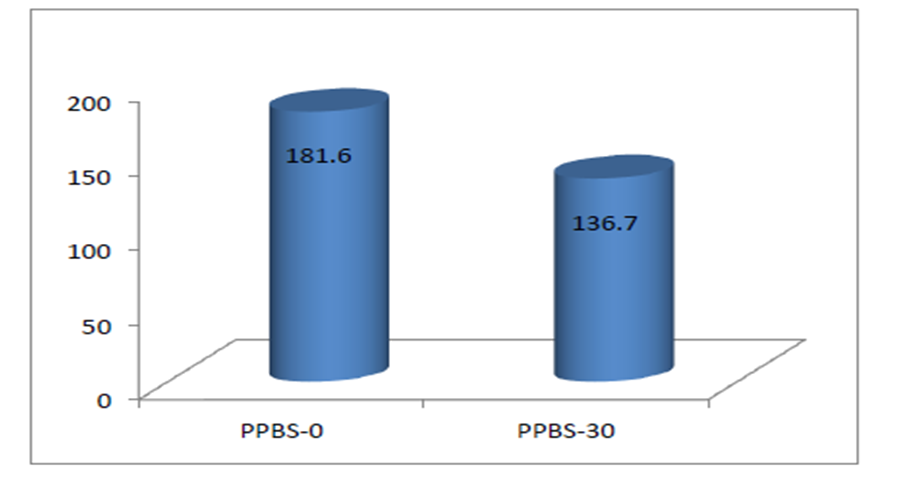
There was a non-significant decrease in the post-prandial blood sugar (PPBS) levels in the experimental group after supplementation from 181.6 ± 82.5 mg/dl to 136.7 ± 21.5 mg/dl (p=0.09) [Fig. 2].
3.4 Dietary History of Experimental Group Subjects
The dietary history of all the subjects was collected using 24-hour recall method. This helps us in finding out the nutritional intake and deficit during the study period for both the experimental and control group. The history was analysed for the intake of macronutrients i.e. Carbohydrates, Protein, Fat and energy. The nutrient intake was analysed for differences before and after supplementation.
The mean intake of Energy, Protein, Carbohydrate, and Fat per day at baseline in the experimental group were 1375.5 ± 135.3kcal, 34.2 ± 6.3g, 228.9 ± 29.3g, and 35.9 ± 3.3g respectively, while after supplementation they were, 1264.3 ± 102.1kcal, 37.9 ± 5.7g, 205.2 ± 23.3g, and 32.2 ± 2.6g respectively [Table. 2].
| Parameters | Experimental group | p value | |
|---|---|---|---|
Before | After | ||
| Energy (kcal) | 1375.5 ± 135.3 | 1264.3 ± 102.1 | 0.037* |
| Energy (kcal/kg body weight) | 19.4 ± 3.5 | 17.8 ± 3 | 0.173 |
| Protein (g) | 34.2 ± 6.3 | 37.9 ± 5.7 | 0.105 |
| Protein (g/kg body weight) | 0.48 ± 0.11 | 0.53 ± 0.12 | 0.223 |
| Carbohydrates (g) | 228.9 ± 29.3 | 205.2 ± 23.3 | 0.026* |
| Carbohydrates (% of total kcal) | 66 ± 3 | 65 ± 3 | 0.105 |
| Fat (g) | 35.9 ± 3.3 | 32.2 ± 2.6 | 0.017* |
| Fat (% of total kcal) | 24 ± 2 | 23 ± 2 | 0.274 |
*- Significant (p<0.05) **- Significant (p<0.01)
There was a statistically significant decrease in the intake of energy, carbohydrates and fats (p<0.05), with a non significant increase in protein intake (p=0.105).
3.5 Blood Sugars of the Control Group Subjects
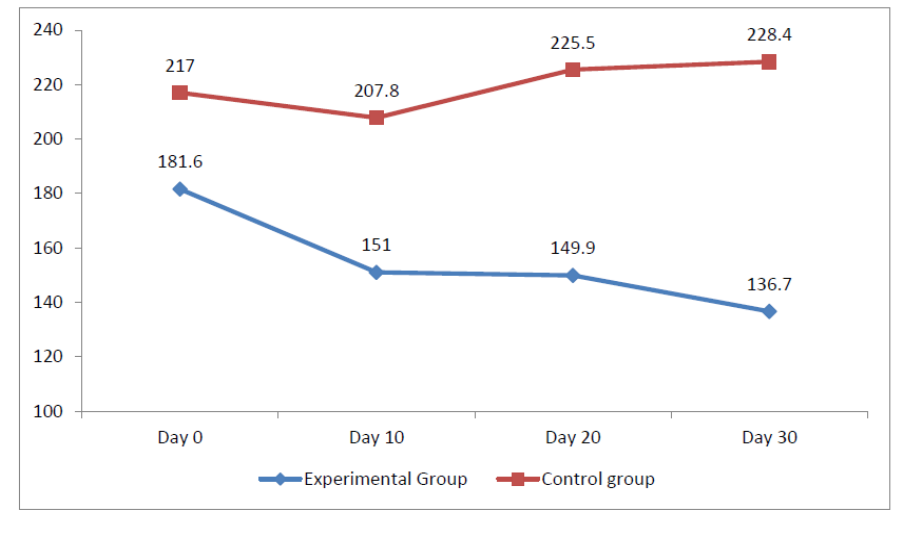
There was a non-significant increase in the PPBS levels in the control group at the end of study period, with the levels changing from 217 (± 83.4) mg/dl to 228.4 (± 101.1) mg/dl (p=0.3974) [Fig. 3].
The mean FBS levels in the control group showed a non-significant increase at the end of the study period, with the mean (± SD) levels increasing from 154.3 ± 61.8 mg/dl to 172.1 ± 80.6 mg/dl (p=0.337) [Fig. 4].
3.6 Dietary History of Control Group Subjects
The mean intake of Energy, Protein, Carbohydrate, and Fat per day at baseline in the control group were 1493.6 ± 136.4kcal, 33.1 ± 6.0g, 259.3 ± 25.3, and 36.0 ± 2.9g respectively, while after supplementation they were 1417 ± 101.6kcal, 35.3 ± 4.6g, 243.6 ± 20.2g, and 33.5 ± 2.0g respectively [Table. 3].
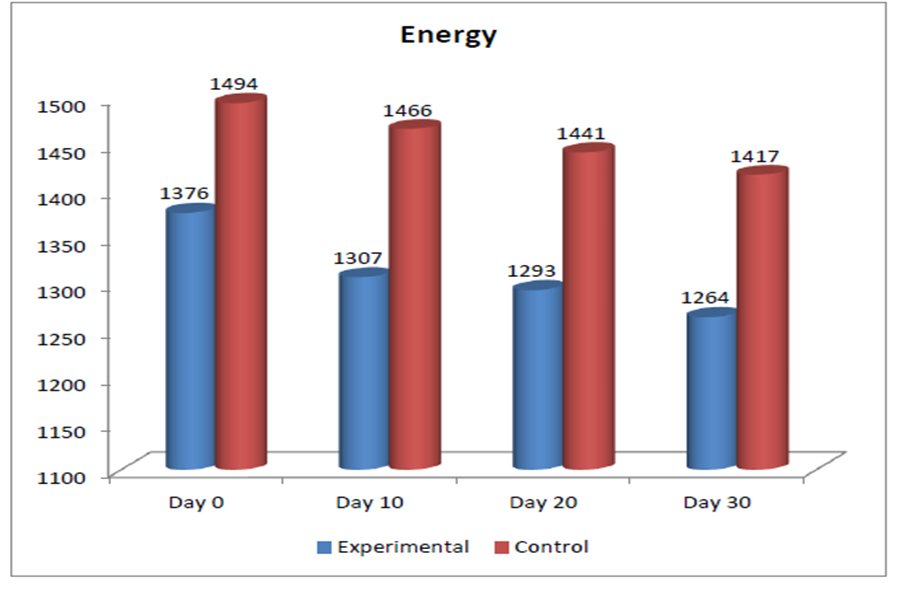
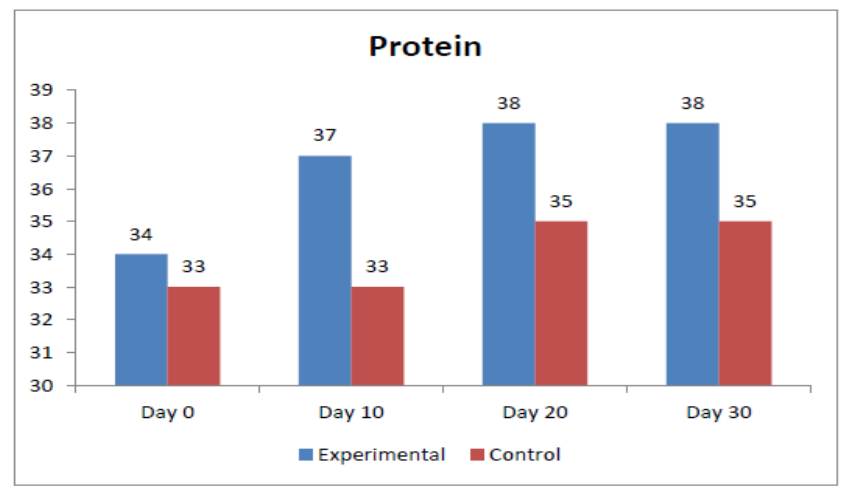
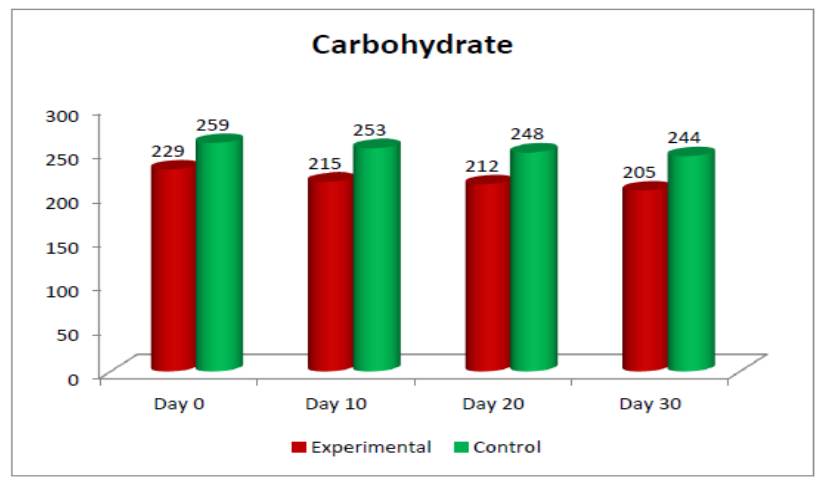
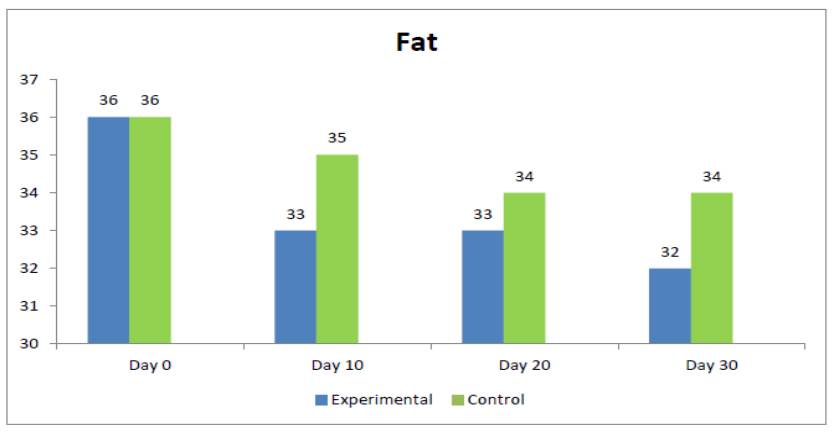
There was a statistically significant decrease in the intake of energy, carbohydrates, and fats (p<0.05) with a non-significant increase in the daily protein intake (p=0.173) [Fig. 5] - [Fig. 8].
Parameter | Control group (Mean ± SD) | p value | |
|---|---|---|---|
Before | After | ||
Energy (kcal) | 1493.6 ± 136.4 | 1417 ± 101.6 | 0.044* |
Energy (kcal/kg body weight) | 21.3 ± 3.8 | 20.1 ± 3.0 | 0.235 |
Protein (g) | 33.1 ± 6.0 | 35.3 ± 4.6 | 0.173 |
Protein (g/kg body weight) | 0.47 ± 0.1 | 0.5 ± 0.09 | 0.235 |
Carbohydrates (g) | 259.3 ± 25.3 | 243.6 ± 20.2 | 0.029* |
Carbohydrates (% of total kcal) | 69 ± 2 | 69 ± 1 | 0.223 |
Fat (g) | 36.0 ± 2.9 | 33.5 ± 2.0 | 0.018* |
Fat (% of total kcal) | 22 ± 2 | 21 ± 1 | 0.223 |
*- Significant (p<0.05) **- Significant (p<0.01)
3.7 Nutritional Status of the Experimental and Control Group Subjects Before and After Supplementation
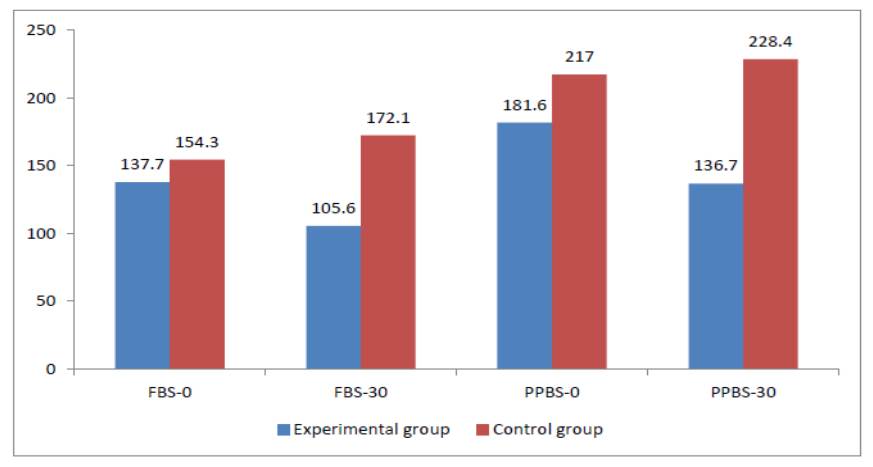
The baseline PPBS levels did not show a statistically significant difference between the experimental and control group. However, with supplementation, the PPBS levels at day10, day 20 and end of study were significantly lower in experimental group as compared to the control group (p<0.05). The decrease in sugars at the end of study in the experimental group were highly significant when compared to control group (p<0.005) [Table. 4].
Parameter (mg/dl) | Experimental group | Control group | p value |
|---|---|---|---|
PPBS-0 | 181.6 ± 82.5 | 217 ± 83.4 | 0.105 |
PPBS-10 | 151 ± 58.2 | 207.8 ± 88.0 | 0.024* |
PPBS-20 | 149.9 ± 41.6 | 225.5 ± 97.1 | 0.037* |
PPBS-30 | 136.7 ± 21.5 | 228.4 ± 101.1 | 0.002** |
*- Significant (p<0.05) **- Significant (p<0.01)
Parameter | Experimental group | Control group | p value |
|---|---|---|---|
Before | 137.7 ± 58.5 | 154.3 ± 61.8 | 0.284 |
After | 105.6 ± 12.4 | 172.1 ± 80.6 | 0.008** |
*- Significant (p<0.05) **- Significant (p<0.01)
Parameter | Experimental group | Control group | P value |
|---|---|---|---|
Energy (kcal) | |||
Day-0 | 1375.5 ± 135.3 | 1493.6 ± 136.4 | 0.0244* |
Day-10 | 1307.6 ± 139.9 | 1466.4 ± 97.3 | 0.004** |
Day-20 | 1293.3 ± 129.6 | 1440.8 ± 113.6 | 0.002** |
Day-30 | 1264.3 ± 102.1 | 1417.1 ± 101.6 | 0.002** |
Protein (g) | |||
Day-0 | 34.2 ± 6.3 | 33.1 ± 6.0 | 0.3264 |
Day-10 | 36.8 ± 5.2 | 33.4 ± 5.0 | 0.081 |
Day-20 | 37.8 ± 5.1 | 34.8 ± 4.1 | 0.081 |
Day-30 | 37.9 ± 5.7 | 35.3 ± 4.6 | 0.145 |
Carbohydrates (g) | |||
Day-0 | 228.9 ± 29.3 | 259.3 ± 25.3 | 0.004** |
Day-10 | 215.4 ± 30.8 | 253.3 ± 18.3 | 0.002** |
Day-20 | 211.5 ± 27.8 | 248 ± 21.5 | 0.002** |
Day-30 | 205.2 ± 23.3 | 243.6 ± 20.2 | 0.001** |
Fat (g) | |||
Day-0 | 35.9 ± 3.3 | 36.0 ± 2.9 | 0.44 |
Day-10 | 33.3 ± 2.7 | 35.2 ± 2.3 | 0.093 |
Day-20 | 32.9 ± 3.1 | 34.4 ± 2.8 | 0.145 |
Day-30 | 32.2 ± 2.6 | 33.5 ± 2.0 | 0.181 |
*- Significant (p<0.05) **- Significant (p<0.01)
The mean FBS levels were not statistically different among the two groups. But, after supplementation, the FBS levels in experimental group were very significantly lower as compared to the control group (p<0.01) [Table. 5].
At the end of study period, there was a significantly lower intake of energy and carbohydrates in the experimental group compared to control group (p<0.01), while there was a non significant decrease in fat and increase in the protein intake in the experimental group compared to the control group. However, the trend towards significantly lower energy and carbohydrate intake in the experimental group was present from the start of the study period (p<0.05) [Table. 6].
4 Summary
Diabetes mellitus (DM) is a group of metabolic diseases characterized by high levels of blood glucose. DM can cause many acute and chronic complications if left untreated. Currently, there is no known cure for DM[10]. The management primarily concentrates on keeping the blood sugar levels under good control, while at the same time also avoiding hypoglycemia. There are many dietary advice and options readily available for diabetics and diet is considered to be one of the cornerstones in the management of diabetes mellitus. The ability of certain pseudo-cereals to lower postprandial glycemia has also been previously reported, including the second meal effect. This effect is beneficial for blood glucose control in diabetic patients and also causes an unanticipated decrease in insulin demands at the subsequent meal. In diabetic subjects, quinoa breakfast meal has shown to improve postprandial glycemia by the second meal effect, resulting in a flattened postprandial curve, and prevention of rebound hypoglycemia. The current study has been planned for supplementation of quinoa meal for reducing postprandial sugars in diabetic subjects.
The sampling technique used in this study was convenience sampling. All the subjects who were diagnosed to have diabetes mellitus and who fulfilled the inclusion criteria were selected randomly for initial assessment. Ten subjects were selected into experimental and control group each.
5 Main Findings
Inferring the age group of the subjects, it is observed that the majority of the subjects fall in the 30-39 years age group, with 40% in the control group and 30% in the experimental group.
According to the gender distribution, it is seen that all subjects were male in the experimental group, while in the control group 10% were females and 90 % were males.
The mean height in the experimental group was 165.5 ± 3.3 cm. The mean weight and BMI in the experimental group were 72.3 ± 9.6 kg, and 26.3 ± 2.9 kg/m2 respectively. The mean height in the control group was 163.9 ± 7.5 cm. The mean weight and BMI in the experimental group were 72 ± 12.7 kg, and 26.8 ± 4.6 kg/m2 respectively. The subjects in the experimental group had a mild, non-significant greater height and weight, and a lower BMI as compared to control subjects.
There was a non-significant decrease in the post-prandial blood sugar (PPBS) levels in the experimental group after supplementation from 181.6 ± 82.5 mg/dl to 136.7 ± 21.5 mg/dl (p=0.09).
The Fasting blood sugar (FBS) levels showed a non-significant downward trend after supplementation, showing a beneficiary effect with the mean (± SD) levels decreasing from 137.7 ± 58.5 mg/dL to 105.6 ± 12.4 mg/dL (p=0.06).
The mean intake of Energy, Protein, Carbohydrate, and Fat per day at baseline in the experimental group were 1375.5 ± 135.3kcal, 34.2 ± 6.3g, 228.9 ± 29.3g, and 35.9 ± 3.3g respectively, while after supplementation they were, 1264.3 ± 102.1kcal, 37.9 ±
5.7g, 205.2 ± 23.3g, and 32.2 ± 2.6g respectively. There was a statistically significant decrease in the intake of energy, carbohydrates and fats (p<0.05), with a non significant increase in protein intake (p=0.105).
There was a non-significant increase in the PPBS levels in the control group at the end of study period, with the levels changing from 217 (± 83.4) mg/dl to 228.4 (± 101.1) mg/dl (p=0.3974).
The mean FBS levels in the control group showed a non-significant increase at the end of the study period, with the mean (± SD) levels increasing from 154.3 ± 61.8 mg/dl to 172.1 ± 80.6 mg/dl (p=0.337)
The mean intake of Energy, Protein, Carbohydrate, and Fat per day at baseline in the control group were 1493.6 ± 136.4kcal, 33.1 ± 6.0g, 259.3 ± 25.3, and 36.0 ± 2.9g respectively, while after supplementation they were 1417 ± 101.6kcal, 35.3 ± 4.6g, 243.6 ± 20.2g, and 33.5 ± 2.0g respectively. There was a statistically significant decrease in the intake of energy, carbohydrates, and fats (p<0.05) with a non-significant increase in the daily protein intake (p=0.173)
The baseline PPBS levels did not show a statistically significant difference between the experimental and control group. However, with supplementation, the PPBS levels at day10, day 20 and end of study were significantly lower in experimental group as compared to the control group (p<0.05).
The mean FBS levels were not statistically different among the two groups. But, after supplementation, the FBS levels in experimental group were very significantly lower as compared to the control group (p<0.01).
At the end of study, there was a significantly lower intake of energy and carbohydrates in the experimental group compared to control group (p<0.01), and a non significant decrease in fat and increase in the protein intake in the experimental group.
6 Conclusion
Improving glycemic control is one of the major therapeutic targets for subjects with diabetes mellitus. Supplementation of lunch meal with quinoa has brought about a significant decrease in postprandial blood sugars as compared with the controls. However, the decrease in sugar levels from baseline did not attain statistical significance, there was also reduction in calorie intake, carbohydrate and fat intake in both the experimental and control groups, being more significant in the experimental group. This highlights not only the effect of supplementation, but the effectiveness of nutritional counselling as well. More research on this would throw light on quinoa supplementation and the overall nutritional status of diabetic subjects.